
Platform


Use your time for what really matters. Get started for free


Customers
Resources


Use your time for what really matters. Get started for free
Pricing
Say goodbye to blind spots in reporting.
Share insights that drive decisions.


.png)
Always live data. Shown your way
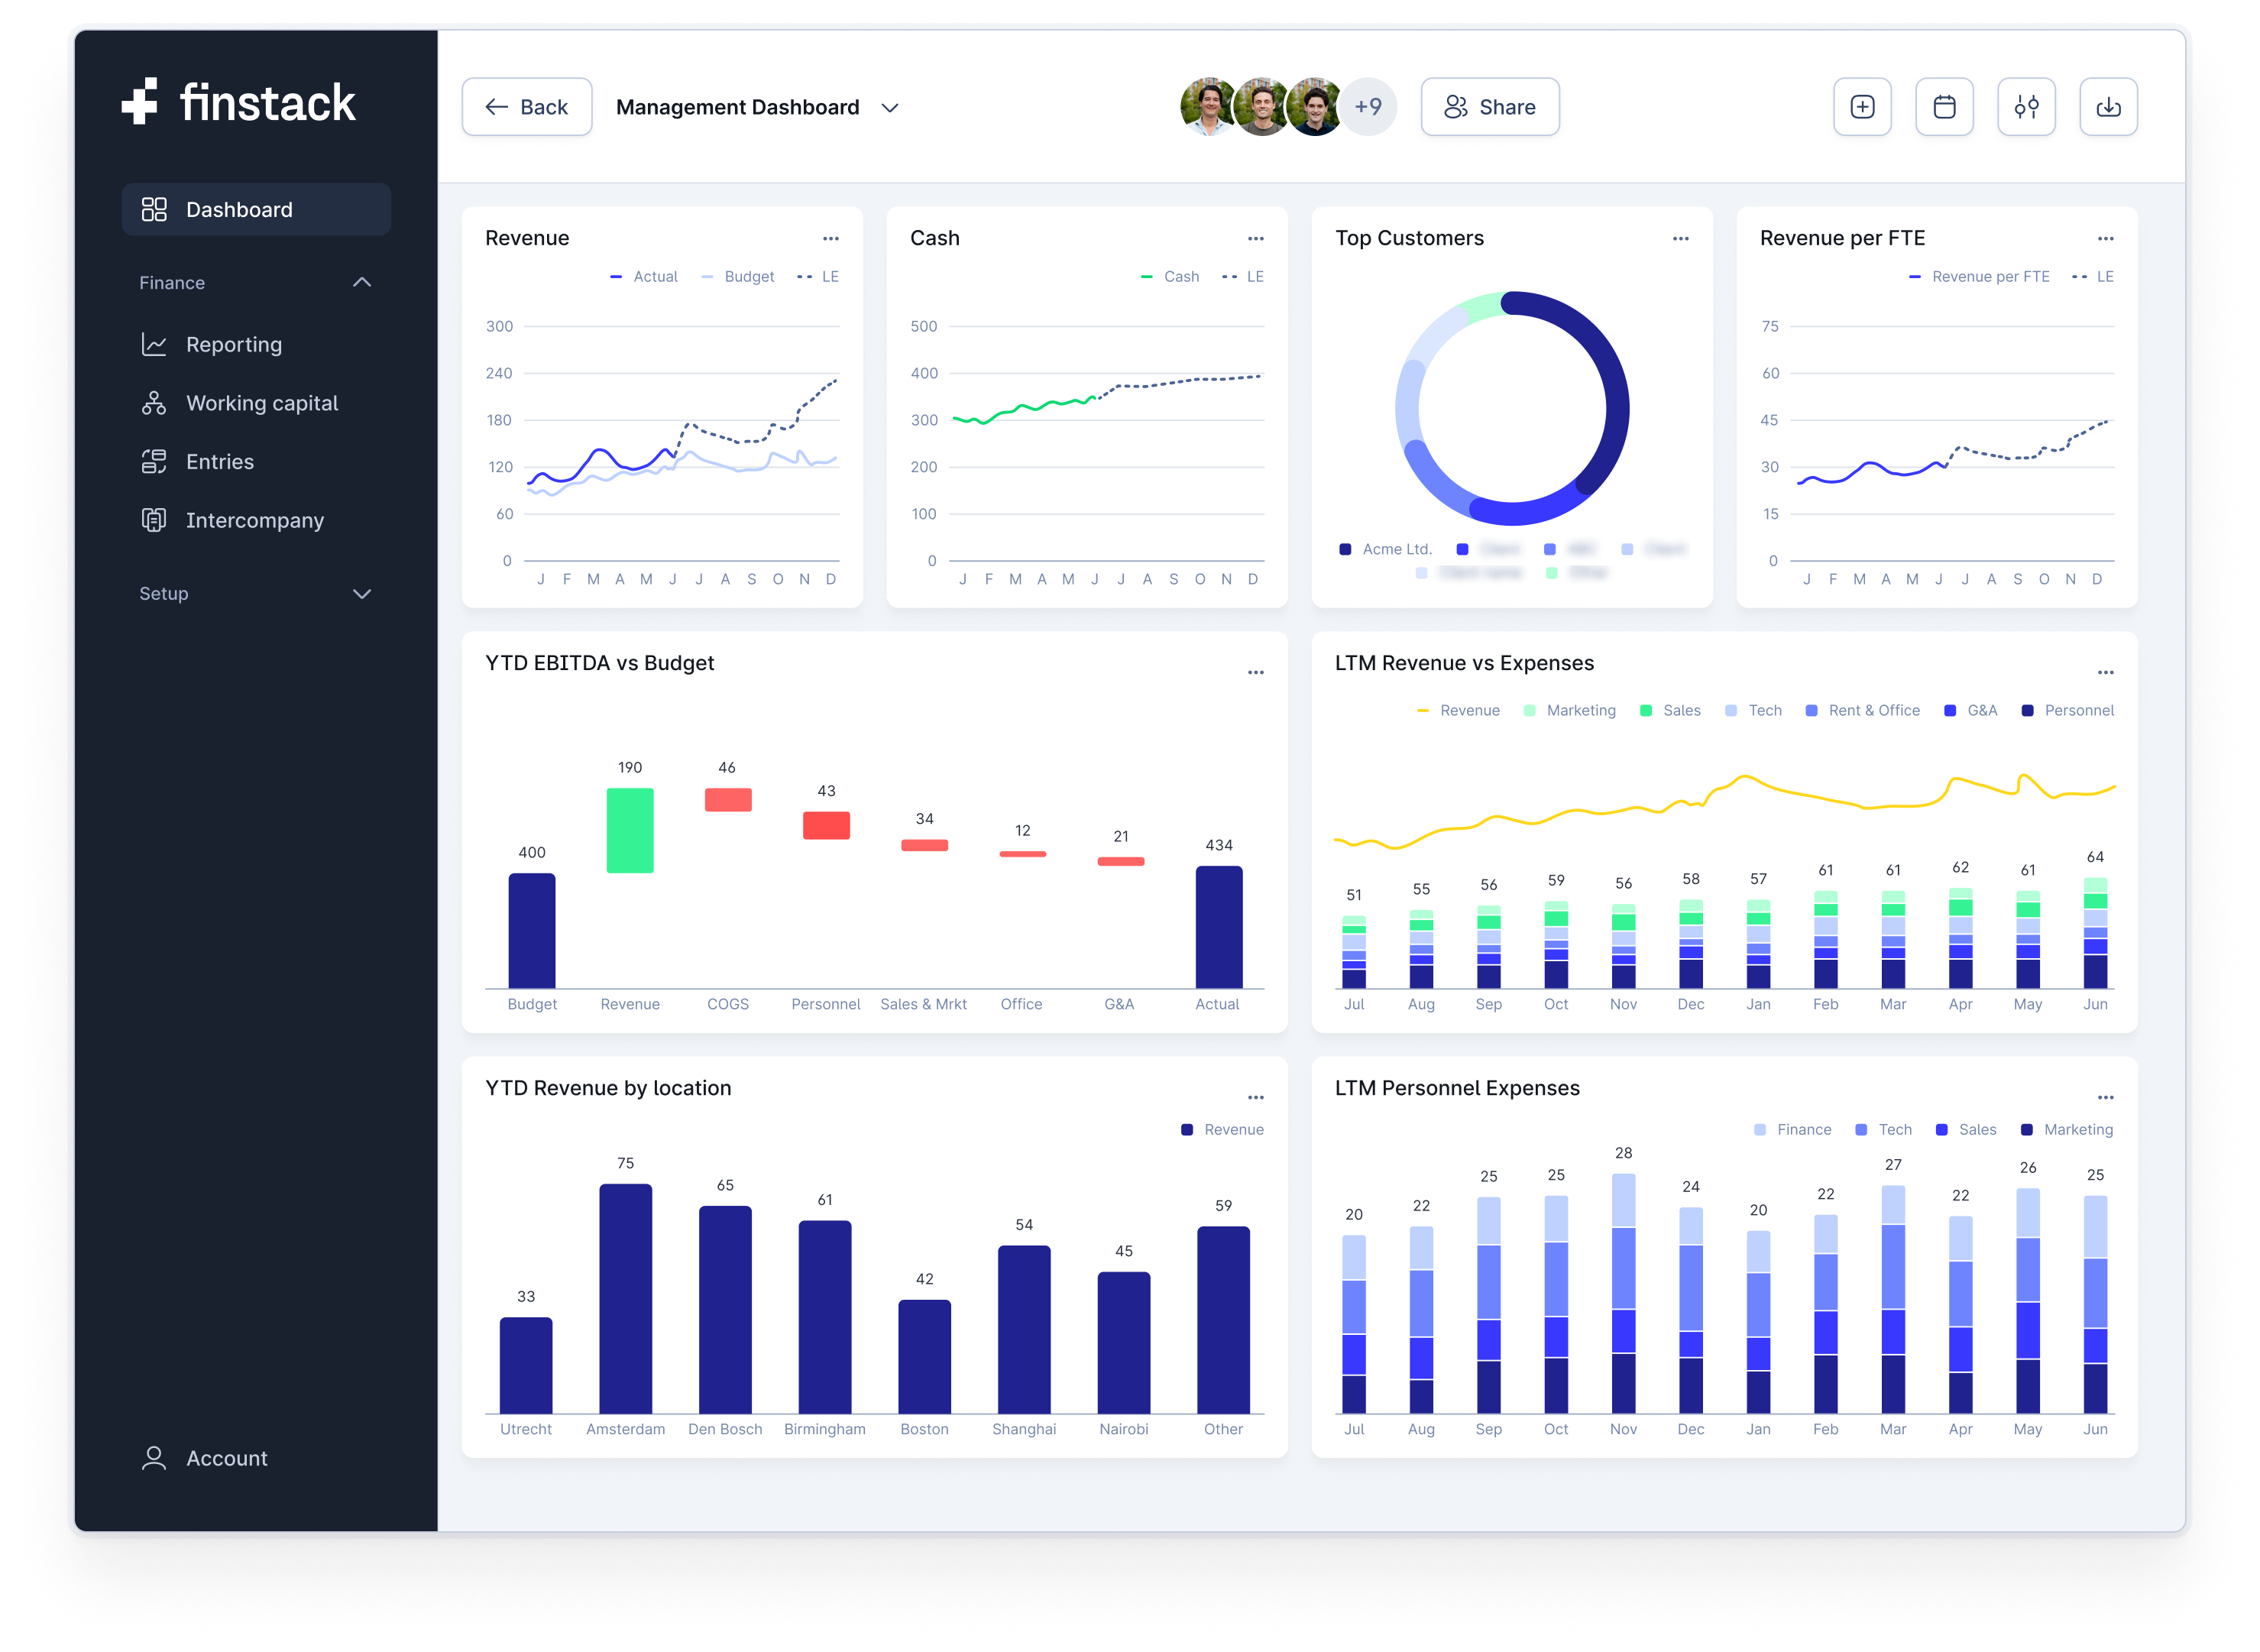
Bring your financials and KPIs together in one place. Forget scattered reports or disconnected spreadsheets. See one clear view of performance everyone can trust.
Slice results by entity, cost center or custom dimension. Create views that match your business and move easily from high level summaries to detailed drill downs.
Give every stakeholder the clarity they need. Dash-boards update instantly and you decide who sees what with flexible sharing and access controls.
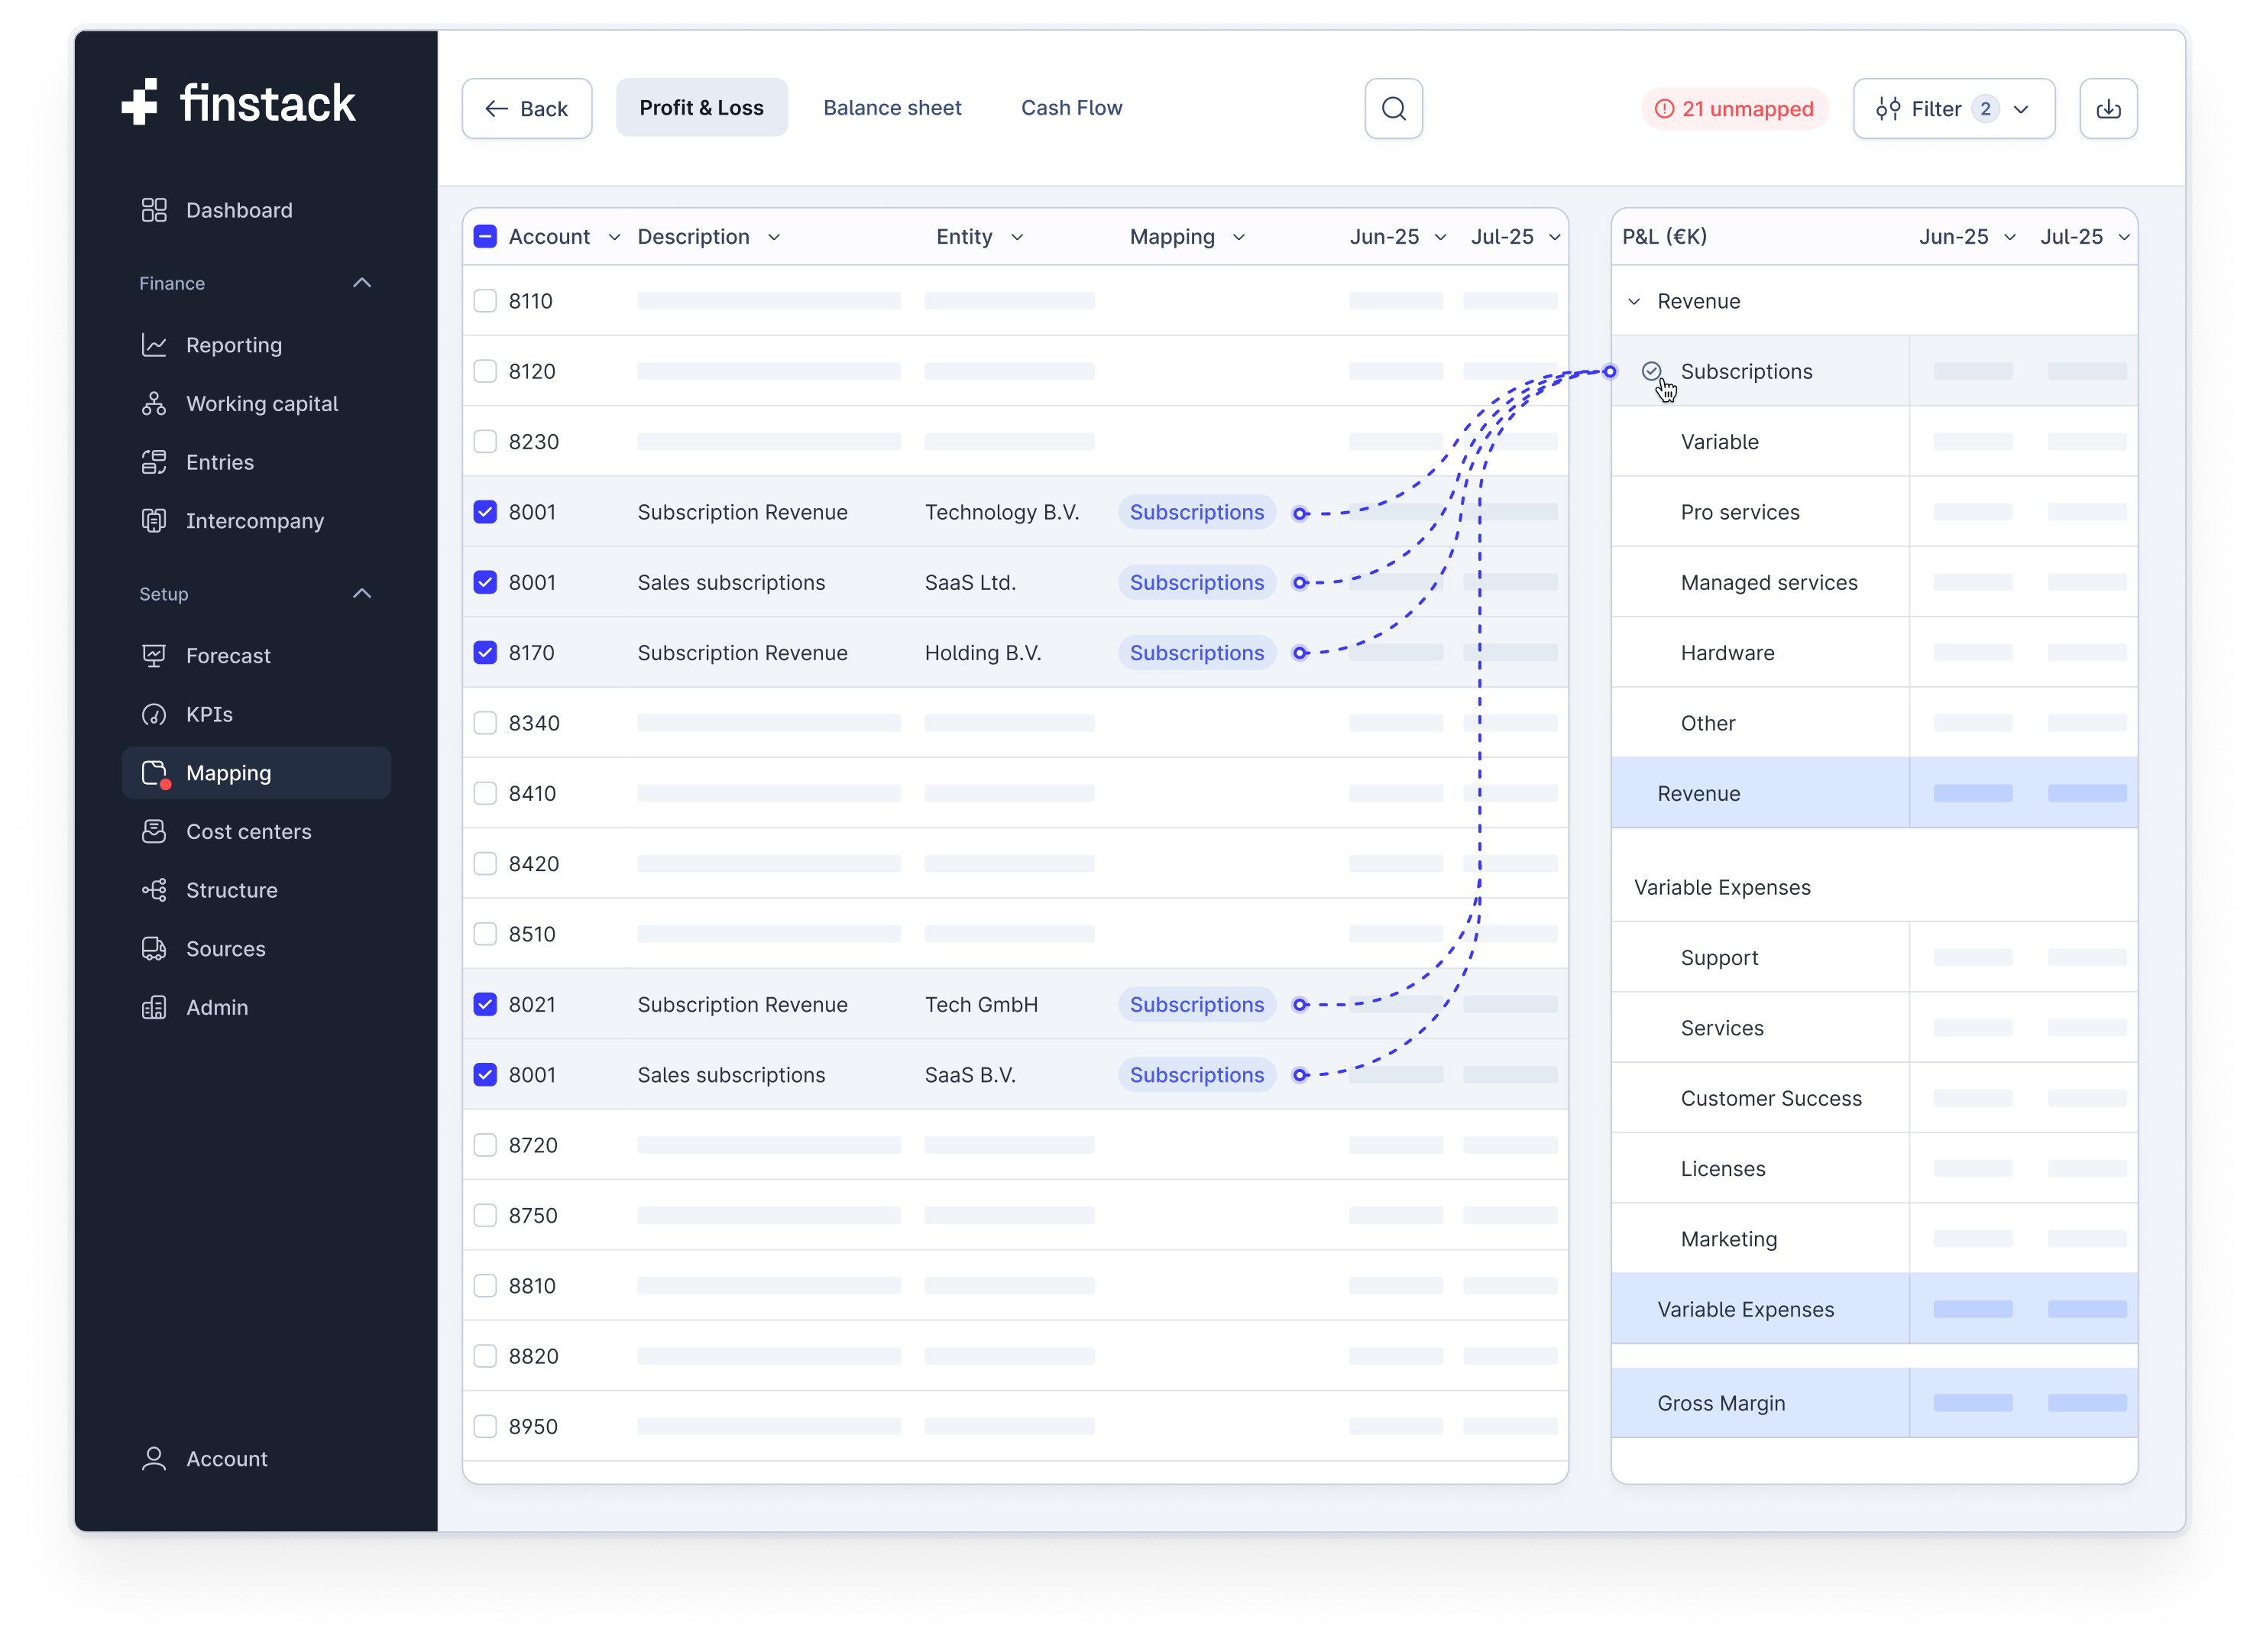
Access live P&L, Balance Sheet and Cash Flow statements without exporting or copy pasting. Actuals flow in automatically, so your reports stay accurate and version chaos disappears. With every close your numbers update instantly, giving you confidence that what you see is always correct.
Switch seamlessly between period views and year-to-date results. Slice data by entity, business unit or cost center to explore performance at the level that matters most. Every view is created in seconds, so you can move from high level overviews to detailed analysis without delay.
Run multiple reporting structures in parallel, from investor reporting to internal management views to tracking business units. Drill into any number with complete transparency, filter and compare across dimensions, and explore results without limits. Everything you need for clarity is available in one place.
.png)
.png)
Bring financial and operational data together in one place. Upload payroll, working capital or custom KPIs, connect them to your financials, and build dashboards that reveal the complete story of your business.
Keep a close eye on cash positions, receivables and payables across entities, business units or teams. Variances are highlighted instantly so you can react quickly and stay in control of every number that matters.
Set targets, track progress and surface key metrics with ease. Whether you are focused on headcount efficiency, supplier performance or overall profitability, Finstack gives you the visibility to steer your business with confidence.
Upload your own KPIs and display them directly alongside your financial dashboards. Track performance the way that matters to your business, whether by cost center, department or any custom dimension.
Apply filters to drill into results at the level of detail you need. Build calculated fields with simple formulas to combine metrics in new ways and uncover fresh insights. Every change updates instantly, giving you a faster and more flexible way to stay on top of performance.
Share the right view with the right people. Granular access controls and built in collaboration features ensure every team works with tailored insights. You stay in control at all times, while colleagues get the clarity they need to act with confidence.
.png)
Read why users love Finstack
“Within hours, we went from scattered Excel sheets to one transparent platform. It’s become my daily tool across all companies I support.”

"With Finstack, we eliminated hours of manual work to consolidate our entities.
Automatic eliminations and real-time insights give us full control while staying focused on growing our business."

"A great combination of reporting and interactive visuals that significantly speeds up our month-end process."

“As a service provider for tech companies, we are always searching for innovative tooling for our customers.
Finstack streamlines the reporting process, helping our customers eliminate manual work and focus on adding value to the business instead.”

“Finstack is not just a reporting tool - it’s my lifeline as a CFO. It can manage our setup where branches are organized as cost-centers."


Link your ERP, HRIS, and spreadsheets to Finstack
See a demo


.png)
Access to all features. No credit card required.
Get started for freeHaven't found your answer? Let us know
You can be up and running within 1 day. Connect your ERP, map your chart of accounts, and begin with automated consolidation, eliminations, and reporting. No heavy setup required.
Yes. Finstack handles consolidations across multiple entities, including intercompany eliminations, minority/non-controlling interest, and sub-group reporting. You can consolidate per group, region or business unit, with full visibility of eliminations and adjustments.
Finstack uses accounting-compliant FX rates. You can convert any currency to your reporting currency automatically, fix historical rates for consistency, or enter your own rates. All FX adjustments are preserved for past reports.
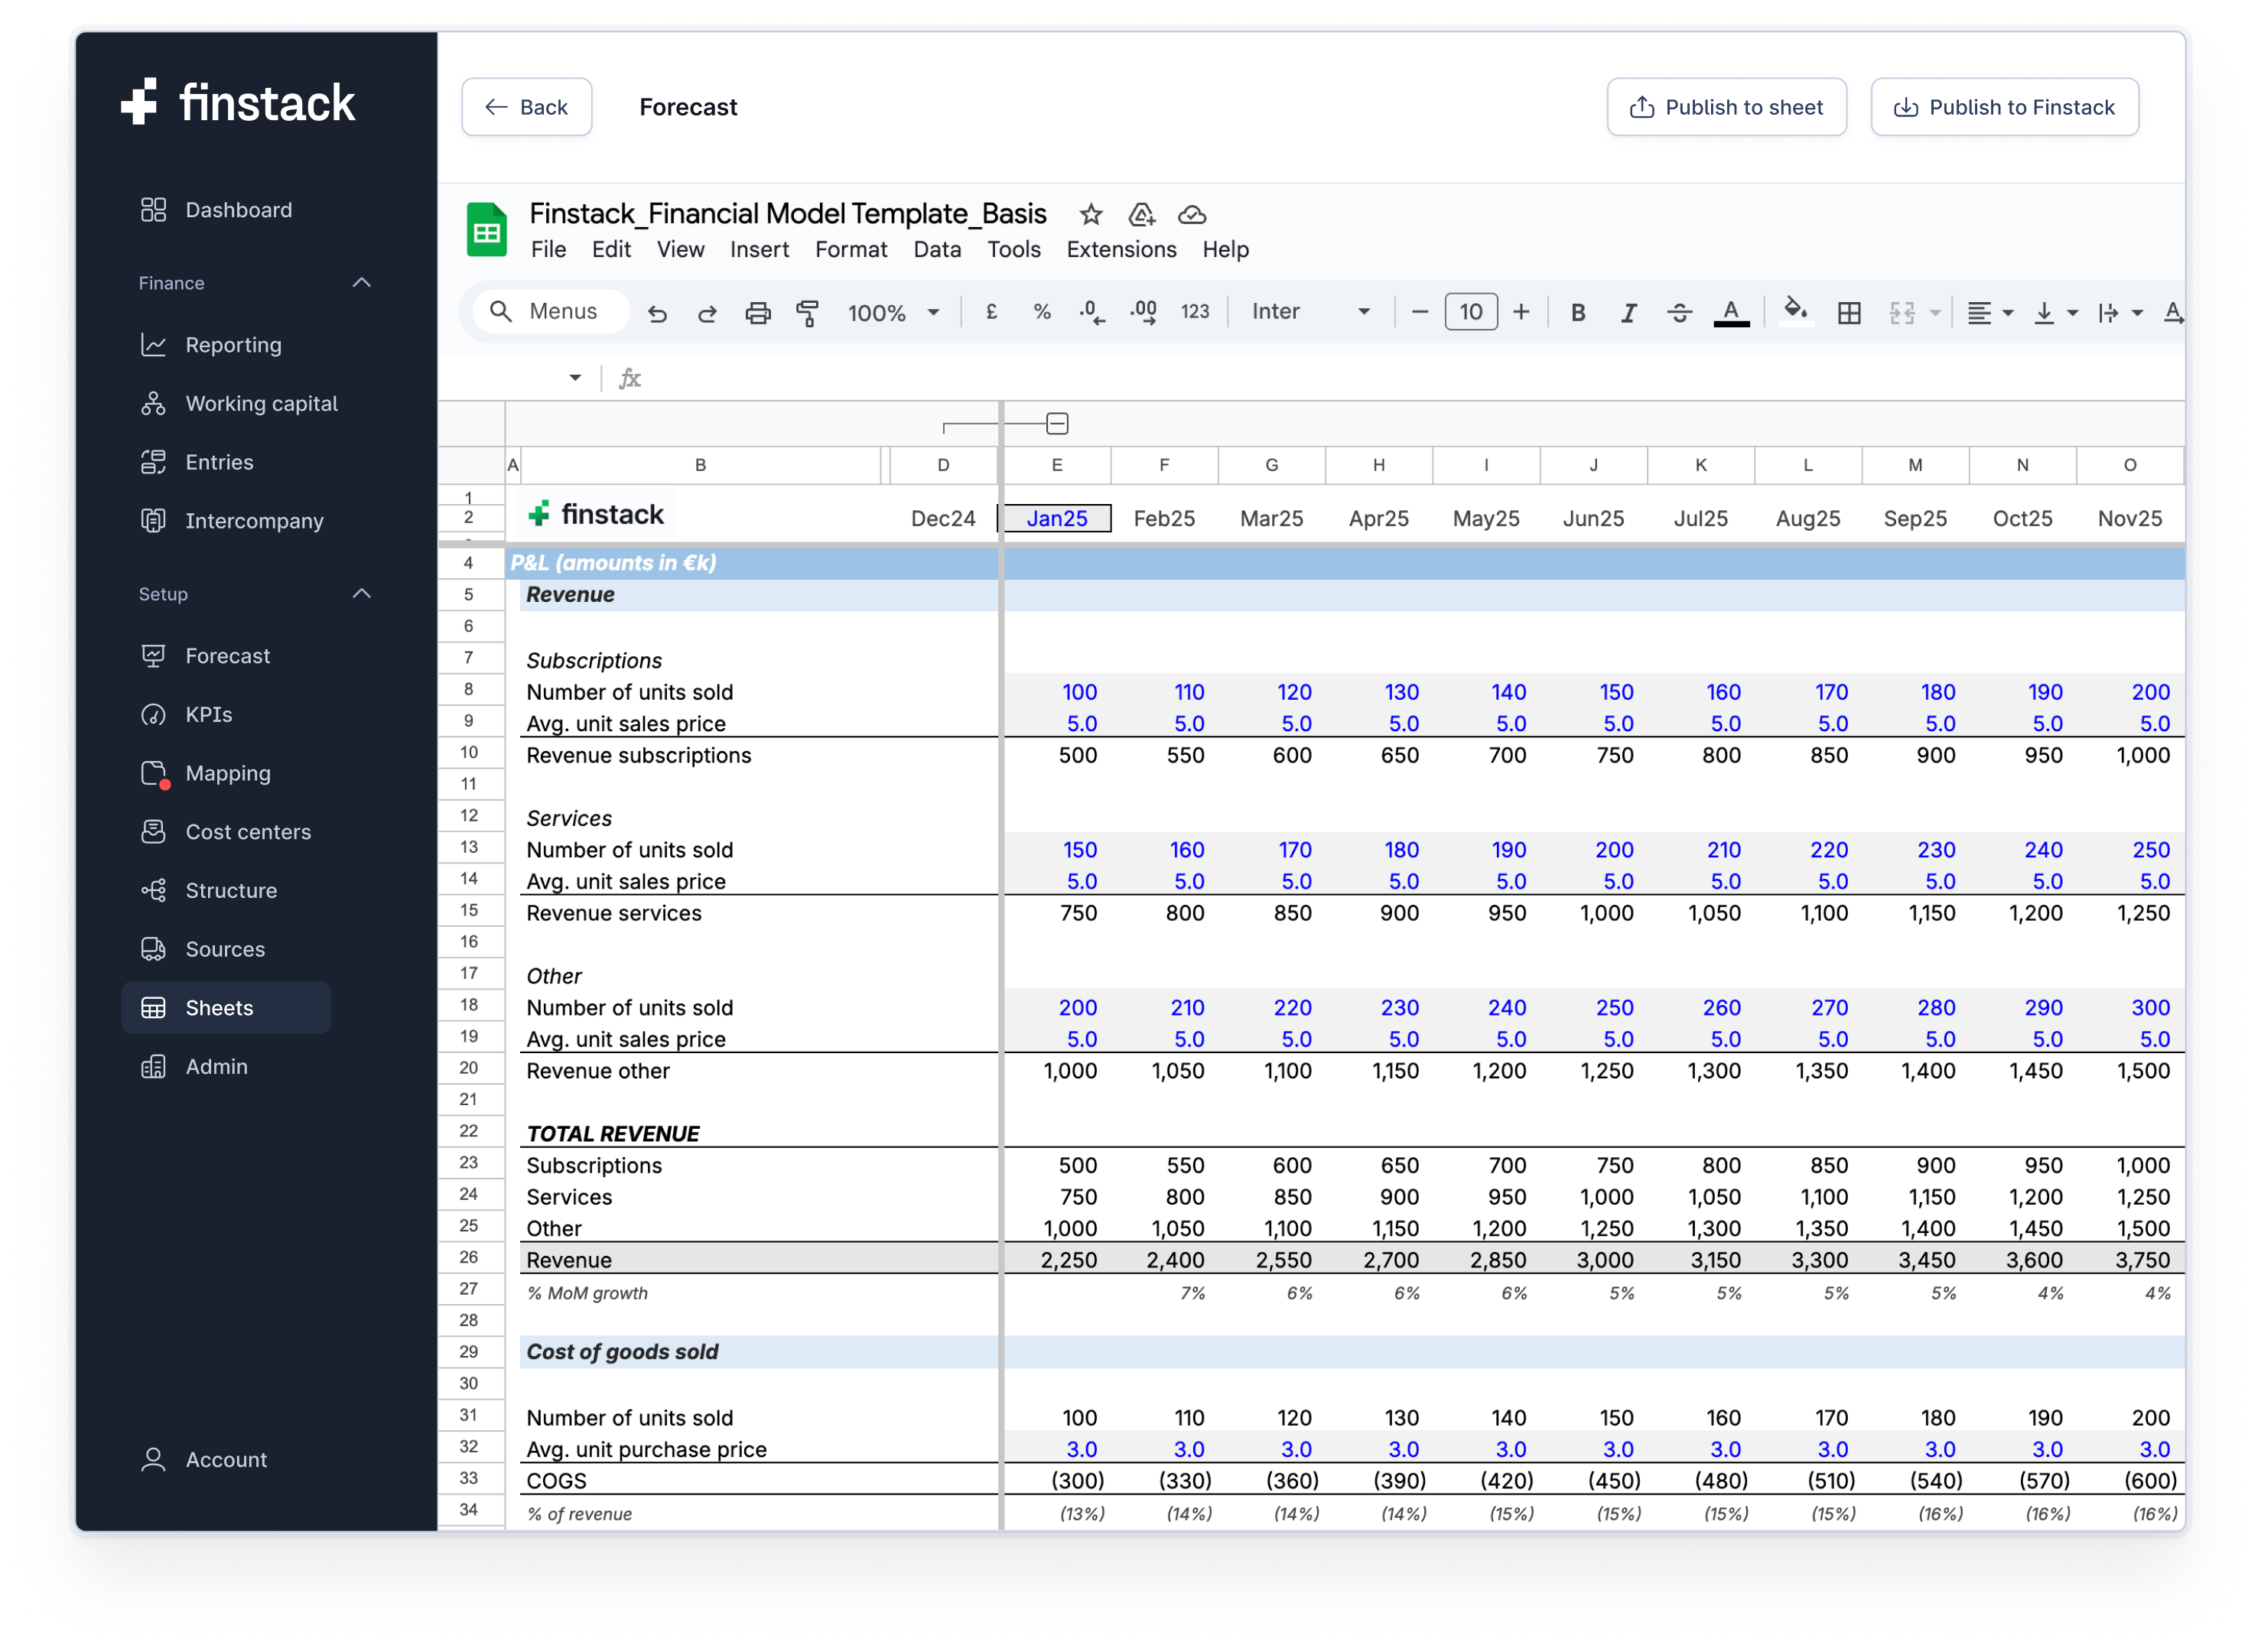
Absolutely. Finstack supports two-way spreadsheet integration. You can continue working in the spreadsheet environment you know, import or start from templates, and have them synced with your data, forecasts, and KPIs.
Very. Financial statements (P&L, Balance Sheet, Cash Flow) and KPI / performance dashboards are updated in real time with actuals. You can filter by entity, cost center, business unit, or custom dimension, compare versions, and track variances live.
You can make manual journal entries, one-off adjustments, revenue recognition before invoicing or cost capitalisation, or other custom adjustments without messing with your ERP. Finstack tracks everything and keeps reports audit-ready.
Security is a top priority. We use encryption (in transit and at rest), role-based access controls, secure hosting, and adhere to industry best practices to protect your data. Plus, version control ensures data integrity over time.
Finstack is flexible. You can add or remove entities, adjust ownership percentages, modify group or sub-group setups, and your consolidation & reporting structure will adjust accordingly. All changes are reflected across financial statements.
Yes, there is a free trial for 14 days (no credit card required) so you can explore all features. After that, we offer different plans depending on the number of entities & add-ons. Have a look at our pricing page our for details.

Consolidated reporting and forecasting.


.svg)

.png)
.png)